| Anyone wishing to study this textbook can learn valuable insights about accounting. Does the mere fact that this book exists mean that everyone knows about accounting principles? Obviously not. By analogy, the same can be said about financial information. Companies, especially public companies, spend substantial amounts of money preparing and presenting financial statements that are readily available (the reports for USA public companies can be found at www.sec.gov). Does this mean that everyone has in-depth knowledge about these companies? Again, no. Some degree of study is required to benefit from the information. It is important to know that CPAs and the SEC provide safeguards to protect the integrity of reported information, but this is entirely different than suggesting that reporting companies are necessarily good investments. For example, a company could report that its revenue stream is in decline, expenses are on the rise, and significant debt is coming due without a viable plan for making the payments. The financial statements may fully report this predicament. But, if financial statement users choose to ignore that report, only they are to blame. One must be very thorough in examining the financial statements of companies in which they are considering making an investment. Sometimes, the evaluation of complex situations can be assisted by utilization of key metrics or ratios. For example, a doctor will consider a patient’s health by taking measurements of blood pressure, heart rate, cholesterol level, and so forth. Likewise, consideration of a company’s health can be measured with certain important ratios. detailed example The following pages summarize the various ratios introduced throughout this textbook. Also shown are ratios and financial statements related to a comprehensive illustration for Emerson Corporation. Verify each ratio calculation to the data included in the financial statements.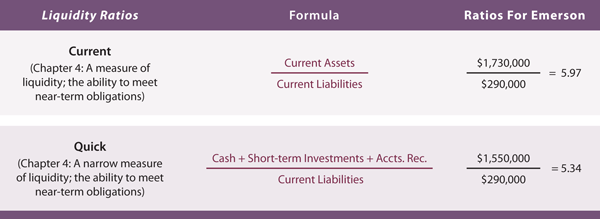 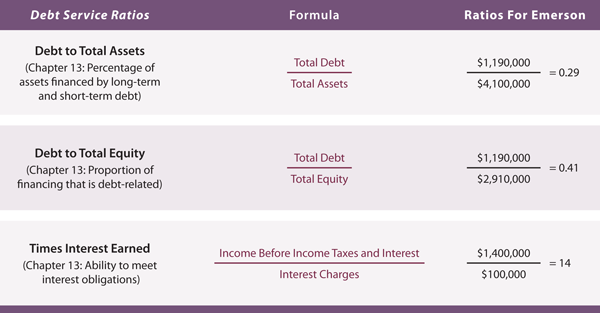 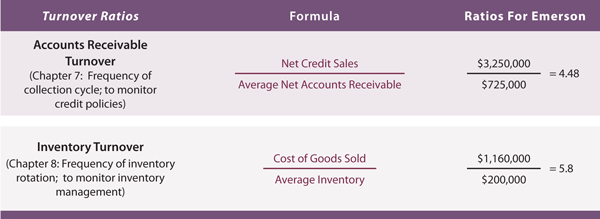 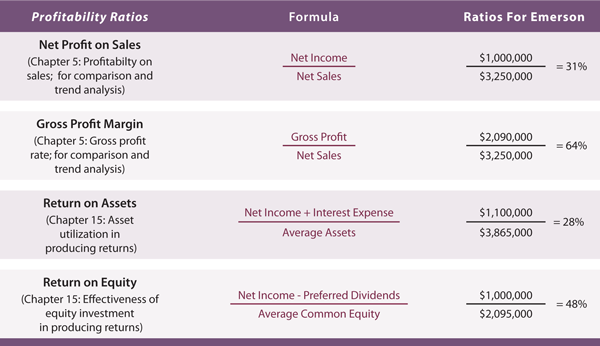 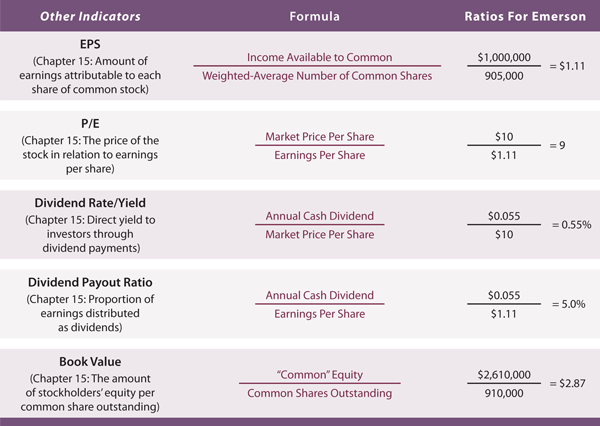 Balance Sheet: 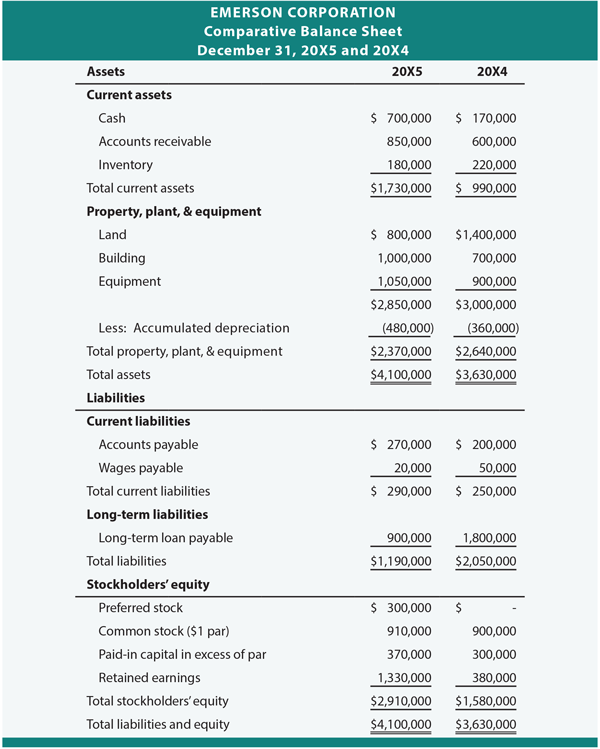 Additional facts for Emerson: It appears that Emerson is doing fairly well. Its liquidity suggests no problem in meeting obligations, the debt is manageable, receivables and inventory appear to be turning well, and profits are good. Statement of retained earnings: 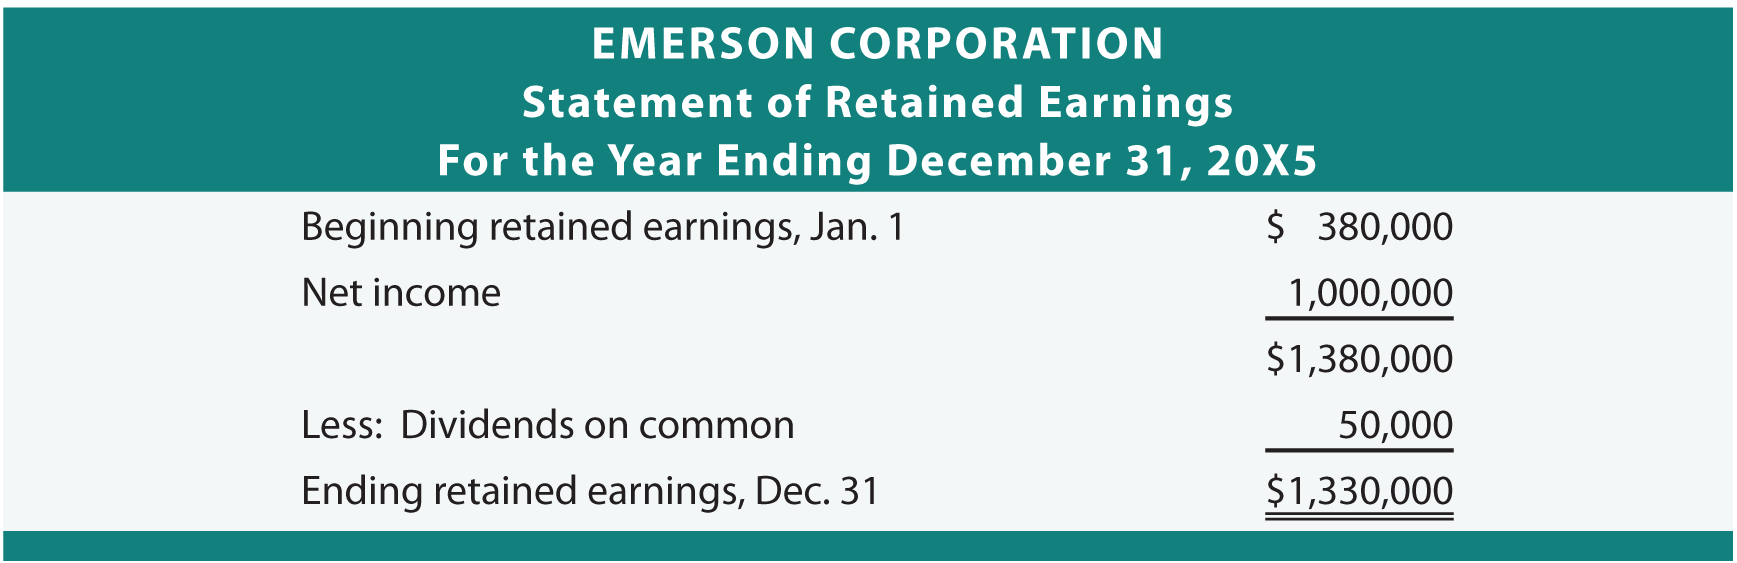 Income statement: 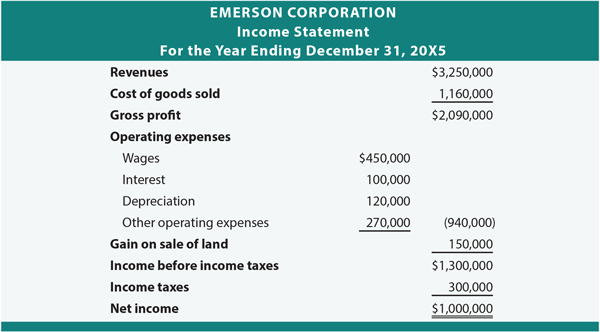 TREND ANALYSIS: 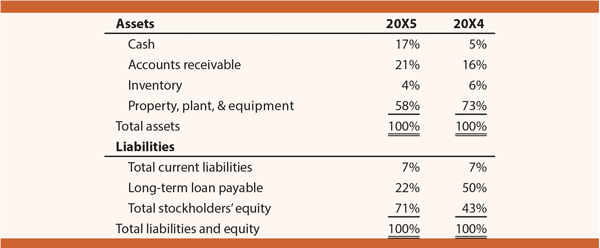 |

A Leading To Self Study
Tuesday, March 8, 2011
Tools for financial statement analysis
Subscribe to:
Post Comments (Atom)
No comments:
Post a Comment
Thanks For Comment!!